Ben Gruber Public Adjusters, Inc. offers worldwide adjusting services, involving high-rise condo, apartment building, warehouses, single and multi-family homes for property damage insurance claims.
According to a report by the National Fire Protection Association, in 2021, local fire departments responded to an estimated 1.35 million fires in the United States. The property damage caused by these fires was estimated at $15.9 billion.
Click here for additional information: http://bengruberadjusters.com/nfpa-statistics/
High Rise Building Fires
During the four year span of 2005-2009, there were over 15,000 reported structure fires, each year, in high-rise buildings. These incidents resulted in more than $200 million in property damages. High-rise buildings often consist of multiple residences and/or several businesses, each with its’ own individual insurance policy. These, along with the buildings’ primary property policy and its’ endorsements lead to frequent challenges throughout the course of the claim.
Warehouse Fires
Warehouse Structure Fires: Analysis and Insights (2016-2020)
Understanding the characteristics of warehouse structure fires is crucial for expert public adjusters. Analyzing data from 2016 to 2020 provides valuable insights into various factors such as structure status, timing, equipment involved, cause of ignition, factors contributing to ignition, heat source, area of origin, and items first ignited. This analysis helps identify trends and patterns that can aid in assessing risk and implementing preventive measures.
Warehouse Structure Status:
Among warehouse fires, the majority (70%) occurred in facilities that were occupied and operating, accounting for a higher share of civilian injuries (76%) and direct property damage. Vacant and unsecured buildings accounted for 14% of fires, while vacant and secured structures constituted half that share. A smaller percentage of fires occurred in idle and unused warehouses. Fires in structures under construction or major renovation made up a small fraction, with minimal direct property damage.
Timing of Warehouse Fires:
Warehouse fires were less likely to occur on Saturdays (13%) or Sundays (11%), following the typical trend for business properties. The remaining days of the week accounted for 15% to 16% of fires. There was little seasonal variation in the distribution of fires by month, except for January, which accounted for 10% of the fires. The other months averaged between 7% and 9% of the total annual fires.
Time of Day:
Warehouse fires were less common during overnight hours, but they were associated with higher property loss. Fires between midnight and 6 a.m. accounted for 18% of the fires, but 45% of the direct property damage. Nearly half of the injuries (46%) were associated with fires occurring between 6 a.m. and 12 p.m.
Equipment Involved in Ignition:
Electrical distribution or lighting equipment was involved in approximately 18% of warehouse fires, contributing to 31% of the direct property damage. Heating equipment was involved in nearly 10% of fires, causing 5% of the direct property damage. Smaller shares of fires were attributed to cooking equipment, torches/burners/soldering irons, or confined commercial compactors. A significant portion of fires (20%) had no equipment information, while 15% were contained trash or rubbish fires.
Cause of Ignition:
Unintentional causes accounted for 60% of warehouse fires, resulting in two-thirds of civilian injuries (66%) and just over half of the direct property damage (53%). Equipment or heat source failures caused 19% of fires and were responsible for one-quarter of injuries and property damage. Intentional fires represented 15% of warehouse fires, causing nearly one-quarter of injuries and 15% of direct property damage. Fires caused by acts of nature were less common but contributed to 8% of the direct property damage.
Factors Contributing to Ignition:
Electrical failures or malfunctions contributed to 21% of warehouse fires, causing approximately one-quarter of civilian injuries and direct property damage. Abandoned or discarded materials/products contributed to 12% of fires, injuries, and property damage. Mechanical failures or malfunctions contributed to 11% of fires but had a smaller impact on property damage and no civilian injuries. Cutting or welding too close to combustible materials and exposure fires each contributed to 6% of fires and injuries.
Heat Source:
Arcing was the leading heat source in warehouse fires, responsible for 14% of fires, direct property damage, and one-fifth of civilian injuries. Powered or operating equipment served as the heat source for approximately one-third of fires, including unclassified heat (14%), sparks/embers/flames (9%), and radiated/conducted heat (9%). Spontaneous combustion/chemical reactions caused 5% of fires but accounted for 15% of civilian injuries.
Area of Origin:
Unclassified storage areas were the most common origin of warehouse fires (12%), resulting in over half of the direct property damage (52%). Shipping/receiving/loading areas accounted for 8% of fires, while storage rooms, tanks, or bins represented 6% of fires. Trash/rubbish chutes, areas, or containers, and processing/manufacturing areas/workrooms each contributed to 6% and 4% of fires, respectively, with the latter associated with a disproportionate share of civilian injuries (13%).
Conclusion:
Analyzing warehouse structure fire data from 2016 to 2020 provides valuable insights into the causes, timing, and factors contributing to these incidents. Understanding the structure status, timing, equipment, ignition causes, contributing factors, heat sources, and areas of origin can guide expert public adjusters in assessing risks and implementing preventive measures. By utilizing this knowledge, public adjusters can effectively support clients in mitigating fire risks and navigating insurance claims related to warehouse fires.
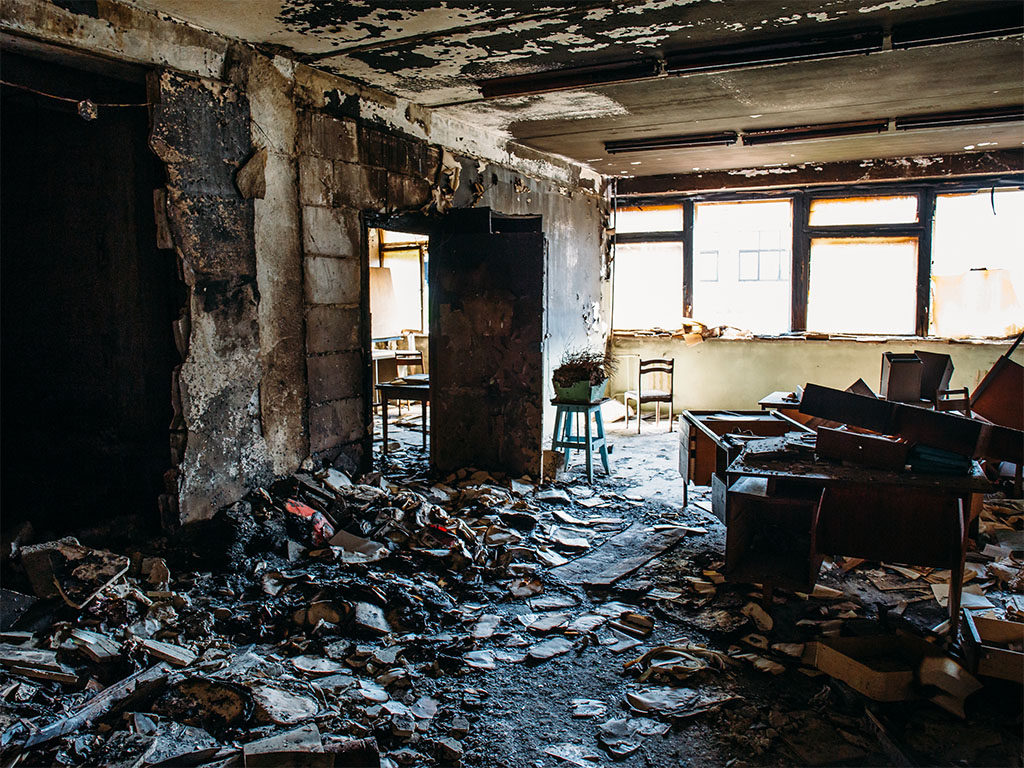
Residential House Fires
Introduction:
Understanding the trends and key findings related to home structure fires is essential for expert public adjusters. Analyzing data from 2016 to 2020 provides valuable insights into the prevalence, causes, and impact of home fires. This analysis covers various aspects such as the number of fires, civilian deaths and injuries, direct property damage, leading causes, trends over time, and areas of origin. By examining these factors, public adjusters can better assist clients in assessing risks, implementing preventive measures, and handling insurance claims related to home structure fires.
Prevalence and Impact of Home Structure Fires:
During the period of 2016-2020, home structure fires accounted for over one-quarter (26%) of reported fires. These fires were responsible for three-quarters (75%) of civilian fire deaths and almost three-quarters (74%) of reported civilian fire injuries. On average, U.S. fire departments responded to approximately 343,100 home structure fires per year, resulting in an annual average of 2,610 civilian deaths, 11,090 civilian fire injuries, and $7.6 billion in direct property damage.
Dangerous Scenarios:
Certain scenarios have shown an increased level of danger compared to the past. Specifically, the death rate per 1,000 reported home fires starting from the ignition of upholstered furniture or mattresses and bedding during 2016-2020 was more than double compared to the rate in 1980-1984. This highlights the increased risk associated with such ignition sources.
Leading Causes of Home Fires:
The majority of home fires and fire casualties were caused by five main factors: cooking, heating equipment, electrical distribution and lighting equipment, intentional fire setting, and smoking materials. Cooking was the leading cause of home fires and injuries during the 2016-2020 period, while smoking materials caused the most home fire deaths.
Trends in Reported Fires:
The number of reported home fires has significantly decreased over the years. In 2021, the estimated number of reported home fires was 54% lower than the estimate in 1980. While the decline in reported fires was most notable in the 1980s, the trend has continued more slowly in subsequent decades. The 2021 estimate of reported fires in one- or two-family homes was 57% lower than in 1980, while apartment fires decreased by 43% compared to 1980. It’s worth noting that apartment fires experienced a 15% increase from 2019 to 2020 but then decreased by 5% from 2020 to 2021.
Rate of Fire Deaths and Injuries:
Although the overall number of reported home fires and home fire deaths has decreased since 1980, the death rate and injury rate per 1,000 reported home fires have remained consistent. In fact, the death rate per 1,000 reported home fires was slightly higher in recent years compared to 1980, particularly for one- and two-family homes. This suggests that the reduction in fire deaths over the past decades has primarily been due to a decrease in the number of fires rather than improved post-fire prevention measures.
Timing and Areas of Origin:
Home fires are more common during the cooler months when people spend more time indoors. From November to March, 46% of home structure fires and 55% of home structure fire deaths occurred. Additionally, the majority of home fires (68%) and fire injuries (68%) originated in living rooms, bedrooms, and kitchens. Kitchen fires were particularly prevalent, especially in apartments, where regulations often require smoke alarms and sprinkler systems.
Conclusion:
Analyzing the data on home structure fires from 2016 to 2020 provides valuable insights into the prevalence, causes, and impact of these incidents. Public adjusters can leverage this information to assess risks, implement preventive measures, and guide clients through the insurance claim process. By understanding the leading causes, dangerous scenarios, and trends over time, public adjusters can effectively assist clients in mitigating fire risks, ensuring proper coverage, and maximizing claim settlements related to home structure fires.
As an owner of investment properties, attempting to manage an insurance claim of this magnitude is overwhelming to say the least. Ben Gruber Public Adjusters, Inc. has vast knowledge of the insurance claims industry and how claims involving high-rise buildings are handled.